An Attempt at Bowling Independent and Dependent Statistics in Cricket
Subscribe on Substack, via RSS/Atom, or follow me on Twitter for updates
Cricket is full of luck for players. That is, it is full of events that are from the perspective of the player inherently chancy. They cannot be certain of these events occurring one way or another. However, these chancy events are not all alike. There is luck that a batter can willingly gamble on independent of what the bowler or pitch does, and luck they cannot control that depends on the bowler and the pitch. I’ve long been interested in working out a way of understanding how these different types of luck affect dismissals for batters. This basically amounts to estimating bowling independent and bowling dependent statistics.
But, this is difficult if not impossible to do with the current freely available data. The freely available scorecards, and ball-by-ball data do not record anything about the luck batters faced. There is also no freely available ball tracking data. If there were, we could calculate how much the ball moved from the straight, how much time batters have to move their hands into the right line or how fast they swing the bat, and we could conclusively say how much luck the batter faced. In its absence we have to rely on our eyes.
To that end, using replays, I have classified dismissals in the recently completed Border-Gavaskar series between Australia and India, into brute luck, option luck and mixed luck dismissals. As I explained in a previous post, the distinction between brute luck and option luck is borrowed from the work of Ronald Dworkin in political philosophy. Brute luck is luck that is the result of factors that a person cannot reasonably control or prevent (eg. various cases of disease, unemployment or disabilities). Option luck is luck that is the result of factors that a person willingly opens themselves to which they otherwise could avoid (eg. gambling or doing extreme sports). Applied to cricket we can say that when the ball moves late in the air, or deviates off the pitch, these are cases of brute luck for the batter. However, when a batter attempts an aggressive shot or attempts to move late towards the ball, they are opening themselves up to chancy events they would not face if they had defended the ball or stayed still. These are cases of option luck. One complication is that both types of luck can occur at the same time. A ball might deviate unexpectedly and the batter may be attempting an aggressive shot. These cases I have classified as mixed luck.
To ensure that my classification is as consistent as possible in the absence of ball tracking data, I constructed some rules to guide me. The rules are structured by three questions: 1) What did the batter attempt? 2) What did the ball do? 3) How did the batter meet the ball?
To answer those questions I started with the following assumptions. Professional cricketers are not inherently stupid nor do they become bad or good overnight at hitting a ball. They are highly trained athletes who have hit thousands of balls in their career. If a batter is defending or pushing and the ball doesn’t move they will middle it 99.9% of the time. If a batter attempts an aggressive shot, say to hit a boundary, and the ball doesn’t move they will at least make some contact with the ball 99.9% of the time. With those assumptions, I classified the dismissals using the following rules.
-
If the batter tries to defend or push the ball and there is clear seam movement, late swing, higher or lower bounce than expected, or more or less turn than expected, and the batter misses completely, edges, or miscues it, that is brute luck.
-
If the batter attempts an aggressive shot, and the ball moves in an unexpected way late, and they miss the ball completely, that is also brute luck.
-
If the batter attempts an aggressive shot and the ball does not move noticeably and the batter misses, edges or miscues it, that is option luck.
-
If the batter attempts an aggressive shot and the ball moves so they edge or miscue it then that is mixed luck (ie. mix of brute and option luck).
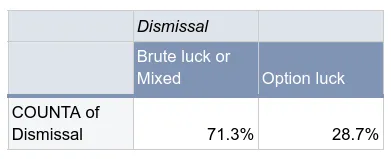
When the dismissals are quantified we see that around 70% of the dismissals were the result of brute luck and mixed luck, and therefore bowling dependent. Only around 29% were primarily the result of factors the batters could control and therefore bowling independent. Without data from other series to compare it is hard to know for certain if this is significantly higher than average. On the face of it though, it does appear to show that the series was largely played on bowler friendly pitches.
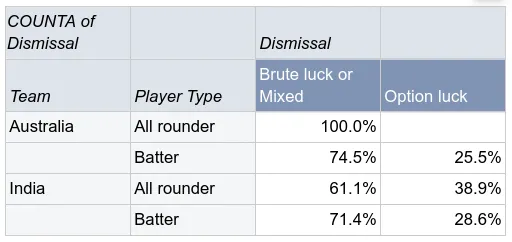
One thing to note is that the above includes bowlers and their batting, which might skew the nature of the dismissals. When we look at the dismissals only for batters and all rounders, bowling dependent dismissals are roughly similar for Australia and India. This probably speaks to the jeopardy that batters from both teams faced, suggesting that both teams possessed reasonably good bowling attacks. However, India’s all rounders appear to have played in a more expansive way with around 38.9% of dismissals being bowling independent while no Australian all round was dismissed in that way. This is likely due to India playing at least two all rounders in four of the five matches, while Australia only ever played one.
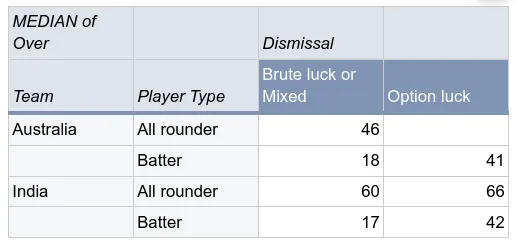
The overall picture of a bowling dominant series is further backed up when we look at the median overs for the dismissals. The median overs for bowling dependent and independent dismissals for batters were similar for both teams. The only slight difference was that India’s all rounders tended to fall to bowling dependent dismissals later than their Australian counterparts indicating perhaps that Australia’s bowlers bowled better for longer.
The final aspect of the series I want to this whole idea to is runs scoring. Now ideally, to get bowling dependent and independent averages one would need to separately sum the runs scored when a batter is in control and not in control and then divide them by the number of bowling dependent dismissals and bowling independent dismissals respectively. However, control data like that tracked by ESPNCricinfo is not publicly available. In lieu of that, we can estimate the expected runs scored per bowling dependent and independent dismissal. In the table below,the bowling dependent mean score is the expected score for a player before getting out due to brute luck or mixed luck. The bowling independent mean score is the expected score for a player before getting out due to option luck including not out scores.
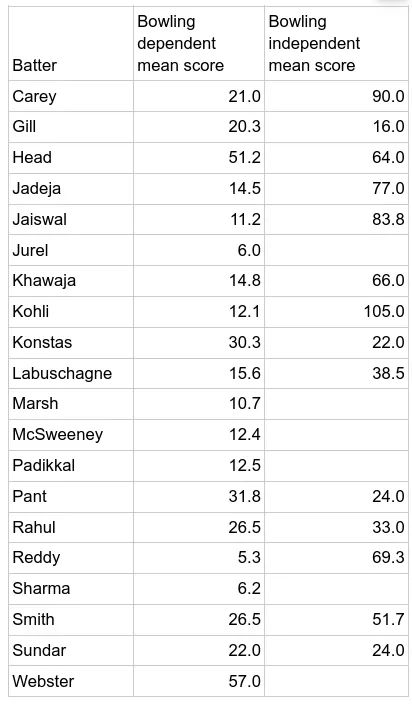
As to be expected the bowling independent mean scores are higher generally. After all one would expect top level batters to score more runs before they are dismissed due primarily to factors under their control. Those who had particular rotten luck are Jurel, Sharma, and Reddy who all have single digit expected scores per bowling dependent dismissal. Marsh also stands out as having had particular bad luck with an expected score of only 10.7 per bowling dependent dismissal. The bowling dependent mean scores backup the view that batting was generally difficult for all the top-order batters. Khawaja, McSweeney, Jaiswal, Kohli, Labuschagne, Sharma, all have bowling dependent scores below 20 indicating many innings ending with dismissals outside their control. Other batters who ostensibly took more chances like Head, Konstas had scores of 51.2 and 30.3 before a bowling dependent dismissal. This perhaps indicates a possible way to counter bowling friendly conditions in the top-order.
Overall, calculating bowling independent and dependent statistics in the way I have done is limited in what it can tell us. It only summarises how a batter’s innings ended and so doesn’t really tell us much about a player’s quality during their innings. Nevertheless I think it is a good exercise that can provide some perspective to the lay cricket watcher on how batters have fared over a series. It can also reveal if certain batting styles yielded better or worse results and provide some insight into the comparative quality of the bowling attacks.