Simulating Teams for the 2022 T20 World Cup
Evaluating player contributions using a monte carlo cricket simulator
Subscribe on Substack, via RSS/Atom, or follow me on Twitter for updates
This is a post that analyses how player selections can make a difference to a team’s chance of winning in the upcoming T20 World Cup. It is also a demonstration of what one can do with the newly added monte carlo simulator modules in the cricketstats package.
It is pretty obvious that in a team game like cricket selecting better performing players will give the team a better chance of winning. To that end, we can determine who the better performing players are by isolating some metrics and analysing those against other players and conclude that, within reason, this will lead to a stronger team performance. But sometimes we might want to go further. We might want to quantify the contribution that different players might make to a team’s performance and overall chance of winning. However, assessing individual contributions is difficult. Two main reasons stand out. One is that outcomes in cricket, especially the shorter formats, involve a lot of variance. Some days a player can get a duck and end up on the winning side and on other days the same player can make a century and lose. This makes it difficult to assess, let alone predict, how much any one particular player, let alone a group of them, will contribute to an outcome that ultimately depends on a number of individual outcomes. Another related issue is that despite the huge amount of short form cricket played these days, the past record of a particular XI is a small sample size. This is only made worse with teams that don’t play each other often. A player’s individual records against particular oppositions will be so small as to be useless in calculating an expected batting or bowling performance.
Monte carlo methods help us overcome these two issues by simulating cricket matches as a series of outcomes determined by the combination of a set of random variables. The cricketstats package now includes two monte carlo simulator modules, a team simulator and a player simulator. You can find details on how to use these simulators in the example python files in the package on github. The main difference being the team simulator simulates ball by ball outcomes based on the entire team’s record, whereas the player simulator simulates the outcomes based on specific players as part of team lineup the user can set up. In its current form the simulator determines the outcome of a ball according to a random choice of defined outcomes weighted by the striker’s scoring and dismissal distribution against the collective distribution of all the bowlers each over. Simulating enough of these outcomes allows us to estimate statistics for a match between two teams. Obviously the simulators aren’t perfect and I hope to keep improving it over time (eg. weightings of records at domestic level and accounting for matchups).
For now, to assess particular player contributions, we can use the player simulator to simulate a larger number of games than the teams in questions will ever play, and arrive at the difference between the expected scores and a difference of their chance of winning. To see the difference that players can make, take two Australian batting lineups and a New Zealand lineup that they might face in their first game of the upcoming 2022 T20 World Cup.
| Australia Legacy | Australia Future | New Zealand |
|---|---|---|
| AJ Finch | JP Inglis | KS Williamson |
| DA Warner | DA Warner | DP Conway |
| UT Khawaja | TH David | MJ Guptill |
| SPD Smith | UT Khawaja | DJ Mitchell |
| M Labuschagne | MP Stoinis | GD Phillips |
| MS Wade | GJ Maxwell | JDS Neesham |
| GJ Maxwell | MS Wade | IS Sodhi |
| PJ Cummins | MR Marsh | LH Ferguson |
| MA Starc | PJ Cummins | TA Boult |
| A Zampa | AC Agar | KA Jamieson |
| JR Hazlewood | JR Hazlewood | TG Southee |
I’ve picked “Australia Future” using only two metrics, boundary percentage and economy rate over the last two years in T20s. The central idea being to construct a team that goes hard at hitting boundaries as much as possible. The “Australia Legacy” lineup is picked based on legacy performance, performance in other formats and the idea of an anchor role in T20. In short, a team that conventional thinking about team selection might lead to. Of course picking better teams using more fine-grained metrics is possible, but for now the crude selection will suffice.
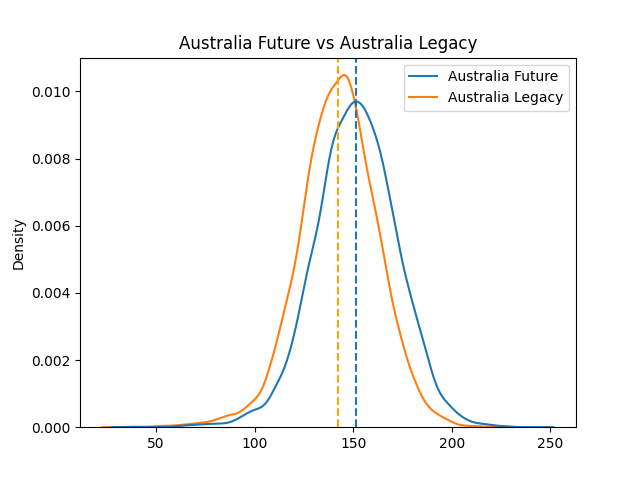
We can then generate a large number of simulated games using those lineups (in this example I used 12,000 games). This provides us with a distribution of first innings scores with some interesting differences. The Australia Future lineup has a higher average score of 151 vs the 142 of the Legacy lineup. However, the Australia Future lineup produces more variance in its scores with a standard deviation of 21 runs vs 20 for the Legacy lineup. This might not seem much but in the chart below we can see the difference.
But what does all this mean in terms of the difference we can expect between the two lineups? Well when we take the distribution of the difference of the two distributions, we can see that the Australia Future lineup posts a higher score than the Legacy lineup roughly 61% of the time. We can visualise this in the chart below.1
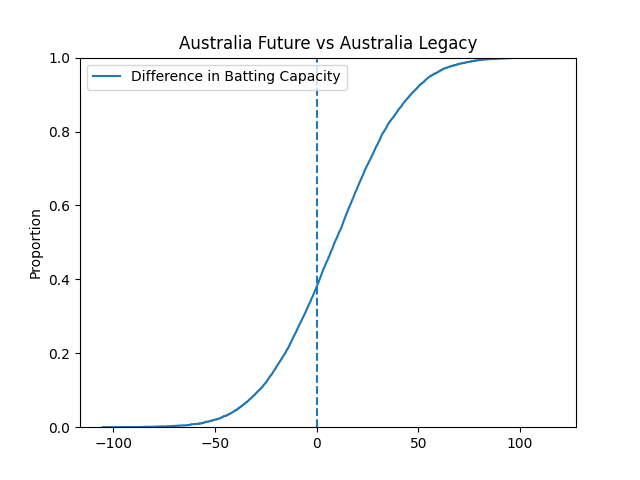
All the differences to the right of the dotted line are positive differences and so instances where the Australia Future lineup posts a higher score than the Legacy lineup. Statistically it is clear that the Future lineup has a clear advantage which contributes to a higher expected win percentage at 60% vs 46% for the Australia Legacy lineup. This will prove especially interesting in the next few weeks as it seems Finch will captain Australia in the upcoming T20 World Cup, and Australia are likely to select players like Smith and Labuschagne despite statistically not being the best choices.
These results are not just a matter of getting lucky with these particular teams. Another example are the following lineups for India against a Pakistan lineup they may face in their first match of the T20 World Cup. This is especially important given India’s poor showing at ICC tournaments and, in the eyes of some at least, continued poor selection of players based on reputation and success in other formats of cricket.
| India Legacy | India Future | Pakistan |
|---|---|---|
| KL Rahul | SA Yadav | Mohammad Rizwan |
| S Dhawan | SV Samson | Babar Azam |
| RG Sharma | RG Sharma | Fakhar Zaman |
| V Kohli | Ishan Kishan | Mohammad Nawaz |
| SS Iyer | DJ Hooda | Khushdil Shah |
| RR Pant | KD Karthik | Asif Ali |
| HH Pandya | HH Pandya | Iftikhar Ahmed |
| RA Jadeja | RA Jadeja | Shadab Khan |
| Mohammed Shami | AR Patel | Haris Rauf |
| B Kumar | B Kumar | Mohammad Hasnain |
| JJ Bumrah | JJ Bumrah | Naseem Shah |
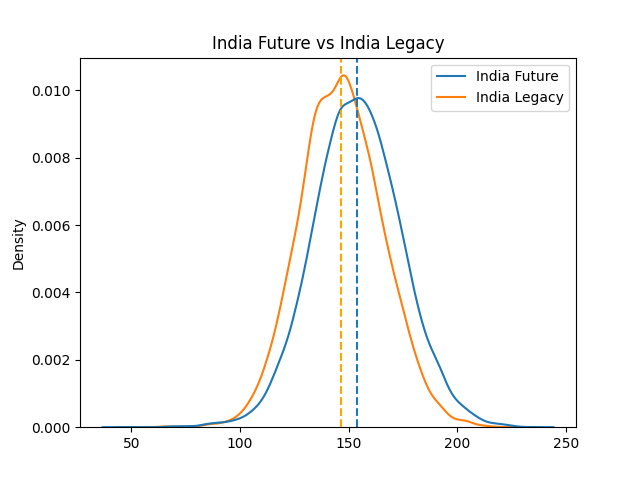
Again running the simulations gives a distribution of first innings scores for the Future lineup a higher average score (154 vs 146), with great variance (standard deviation of 20 vs 19).
The distribution also shows that we can expect the India Future lineup to score more than the Legacy lineup close to 60% of the time.
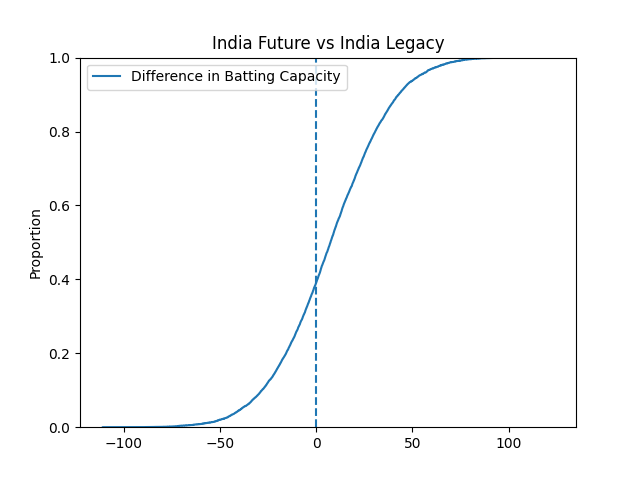
The result of all this is that the India Future lineup wins 65% of the time, whereas the Legacy lineup wins 53%.
The lesson, as it was in the case of Australia, appears clear. For a higher chance of winning, pick batters who are more aggressive boundary hitters, and pick bowlers who are more economical. Picking players based on reputation and performances in other formats will not maximise a team’s chance of winning.